
Using AI to build a robust testing framework
Adding tests and monitors to dbt using Cursor, Claude, and dbt’s MCP server

This is part two of a three-part series on using AI in data engineering. In Part 1, we looked at how you can use AI in data modelling. In this part, we test and monitor the data using AI, and in Part 3, we show you how to perform self-serve analytics on a semantic layer.
In this post, we’ll use AI to help us build a robust testing and monitoring framework. To recap, we’ve got our data in Snowflake, transformed through dbt, and have a semantic layer we’ll expose in Omni.
Our game plan for this section:
Testing models (sources, staging, and marts): We’ll base this on this guide for testing
Testing metrics: We’ll use our expectations and exploratory data analysis on the metrics to come up with tests
We’ll use dbt YML files as our source of truth for where tests will be placed and will supplement dbt tests with anomaly monitors (e.g., volume, freshness), also managed through dbt YML files.
Our approach is to code in Cursor, but use dbt’s MCP server in Claude, as that can query and return output of running queries, which is key for everything else.
Let’s dive in!
Framing our testing strategy
To test our data models, we’ll provide some guidelines to the LLM, mostly based on this guide for testing best practices. Here’s a summary of our testing principles that we input to Cursor and Claude to keep track of.
General Principles
- Use warn vs. error severity levels to reflect actual impact. Errors should block deployments; warnings highlight issues to monitor.
- Data assets tagged importance: P1 (or upstream of these) require more extensive testing.
- Avoid testing business logic assumptions that aren't visible from the SQL—focus on what can be objectively verified.
- Fewer, high-signal tests are better than too many noisy or brittle ones.
- Always leave a short comment on why each test is in place (e.g., “ensures IDs are unique to avoid joins blowing up”).
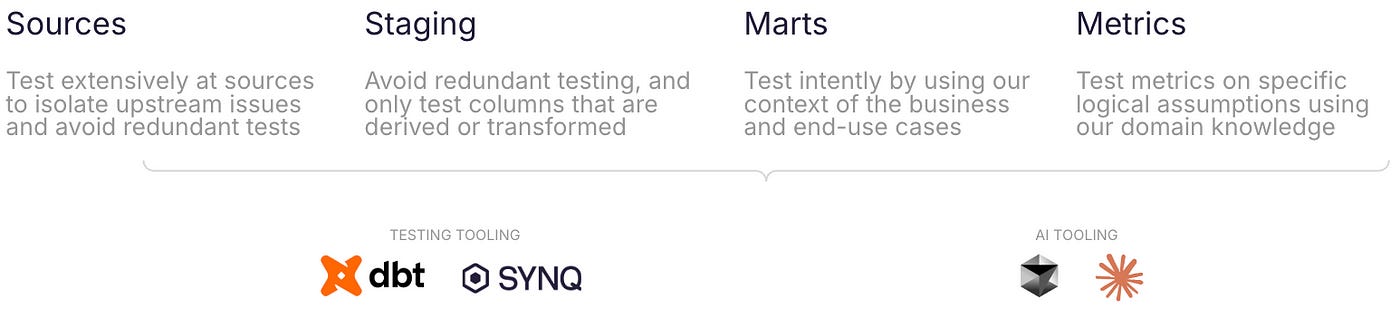
Layer-specific Guidance
- Sources: Test thoroughly using standard dbt source tests (e.g., unique, not_null, accepted_values). Mark source tables with a table_stats: true flag in YAML to activate SYNQ anomaly monitoring.
- Staging: Avoid redundant tests. Only test columns that are transformed, derived, or critical for downstream joins/filters.
- Marts: This is where business rules start to appear. Add custom tests only where you’ve validated the logic directly via SQL (e.g., verifying status values with a SELECT DISTINCT). Use this to prevent assumptions baked into dashboards.
Additional Tips
- Before writing a test, query the data directly to understand realistic constraints (e.g., should this value ever be zero? How many distinct values exist?).
- When in doubt, prioritise coverage on high-impact data products and the metrics they feed.As we add tests, we’ll take one model at a time and review that. This lets us stay in control and is the approach I’ll recommend.
Testing well is hard! You need to anticipate everything that could go wrong with the data and express that into code. This requires both a deep understanding of upstream systems, data transformations, and downstream use cases of the data.
Testing sources
Sources are where we want to do most of the testing. It ensures that issues don’t propagate downstream, saves us lengthy debugging times, and also helps isolate that issues are likely due to upstream systems and sources, and not a fault of data transformations.
While we code in Cursor, we’ll turn to Claude to give input on our testing strategy. The reason for this is that Claude can access raw data and run queries. For example, accepted values can automatically be extracted from all the unique values in a field, or values can be set to be expected to be greater than 0 based on actual values
Prompt: ✨Take one source at a time and add relevant tests following the testing strategy I shared. Query the raw data to make sure all assumptions are exhaustive and represent the actual dataLet’s go through a few examples of the tests generated
- name: MAANED
  description: "Month in format YYYYMDD (e.g., 2022M01). Time series from 2022M01 to present"
  tests:
    - not_null:
        severity: error
        # Comment: Time dimension must always be present - critical for time series analysis
    - dbt_utils.expression_is_true:
        expression: "REGEXP_LIKE(MAANED, '^20[0-9]{2}M(0[1-9]|1[0-2])$')"
        # Comment: Validates that the MAANED field matches expected format like 2022M01
For the month (MAANED) text field, we’ve gotten a clever regular expression that assumes that YYYY is a year from 2000–2099, mm is a valid month from 01–12, and the letter M separates the year and month. That seems about right!
- name: OMRAADE
  description: "Property type category: Ejerlejlighed (Condos), Fritidshus (Holiday homes), Parcel-/rækkehuse (Houses/Townhouses)"
  tests:
    - accepted_values:
        values:
          - "Ejerlejlighed"
          - "Fritidshus"
          - "Parcel-/rækkehuse"
        config:
          severity: warn
        # Comment: Validates against known property types - prevents invalid categories
For the house types, we’ve gotten an exhaustive list of accepted values based on the actual data, with a severity warn, which is great.
- name: ANTAL_BOLIGER
  description: "Number of properties/houses (count)"
  tests:
    - not_null:
        severity: error
    - dbt_utils.expression_is_true:
        expression: "ANTAL_BOLIGER >= 0"
        config:
          severity: error
        # Comment: Lower bound check to ensure count is not negative
    - dbt_utils.expression_is_true:
        expression: "ANTAL_BOLIGER <= 15000"
        config:
          severity: warn
        # Comment: Outlier detection - flags unusually high values for review, current max value is 9900
It also added some reasonable logic to the number of properties sold. First of all, the number cannot be negative. I agree with that. Secondly, it ran a query to understand that the current max number of properties in a postcode for sale is 9,900 and added an upper limit of 15,000. While I like the reasoning, we’ll get rid of that and add a more flexible anomaly monitor later on.
- name: HOUSES_ON_MARKET
  description: "Houses on market data with counts by month, property type, and region"
  tags: [table_stats_monitor, importance:P1]
  columns:
    - name: MAANED
      description: "Month in format YYYYMDD (e.g., 2022M01). Time series from 2022M01 to present"
      tests:
        - not_null:
            severity: error
            # Comment: Time dimension must always be present - critical for time series
Finally, it added relevant not null and unique tests as well as a table_stats_monitor tag as requested. We’ll point directly to this and tell SYNQ to add automated anomaly detection monitors wherever this tag is present.
There are other tests I don’t agree with. This goes to show the typical workflow is which is more of a back-and-forth with the AI than a take-it-at-face value exercise. Even if the max date is July 2025, there’s no particular need to get notified when we month exceeds 2027M12, so we’ll remove that.
- dbt_utils.expression_is_true:
    expression: "MAANED <= '2027M12'"
    config:
      severity: warn
    # Comment: Outlier detection – flags unusually future dates for review, current max expected is 2025M07
We’ll go through and repeat this process for each source. Note how we don’t blindly accept tests but instead spend time reviewing each of the suggestions about our expectations for the data. This is the workflow I’ve seen work best, where you riff with the AI but chip in with your own knowledge and context.
Testing transformations and marts
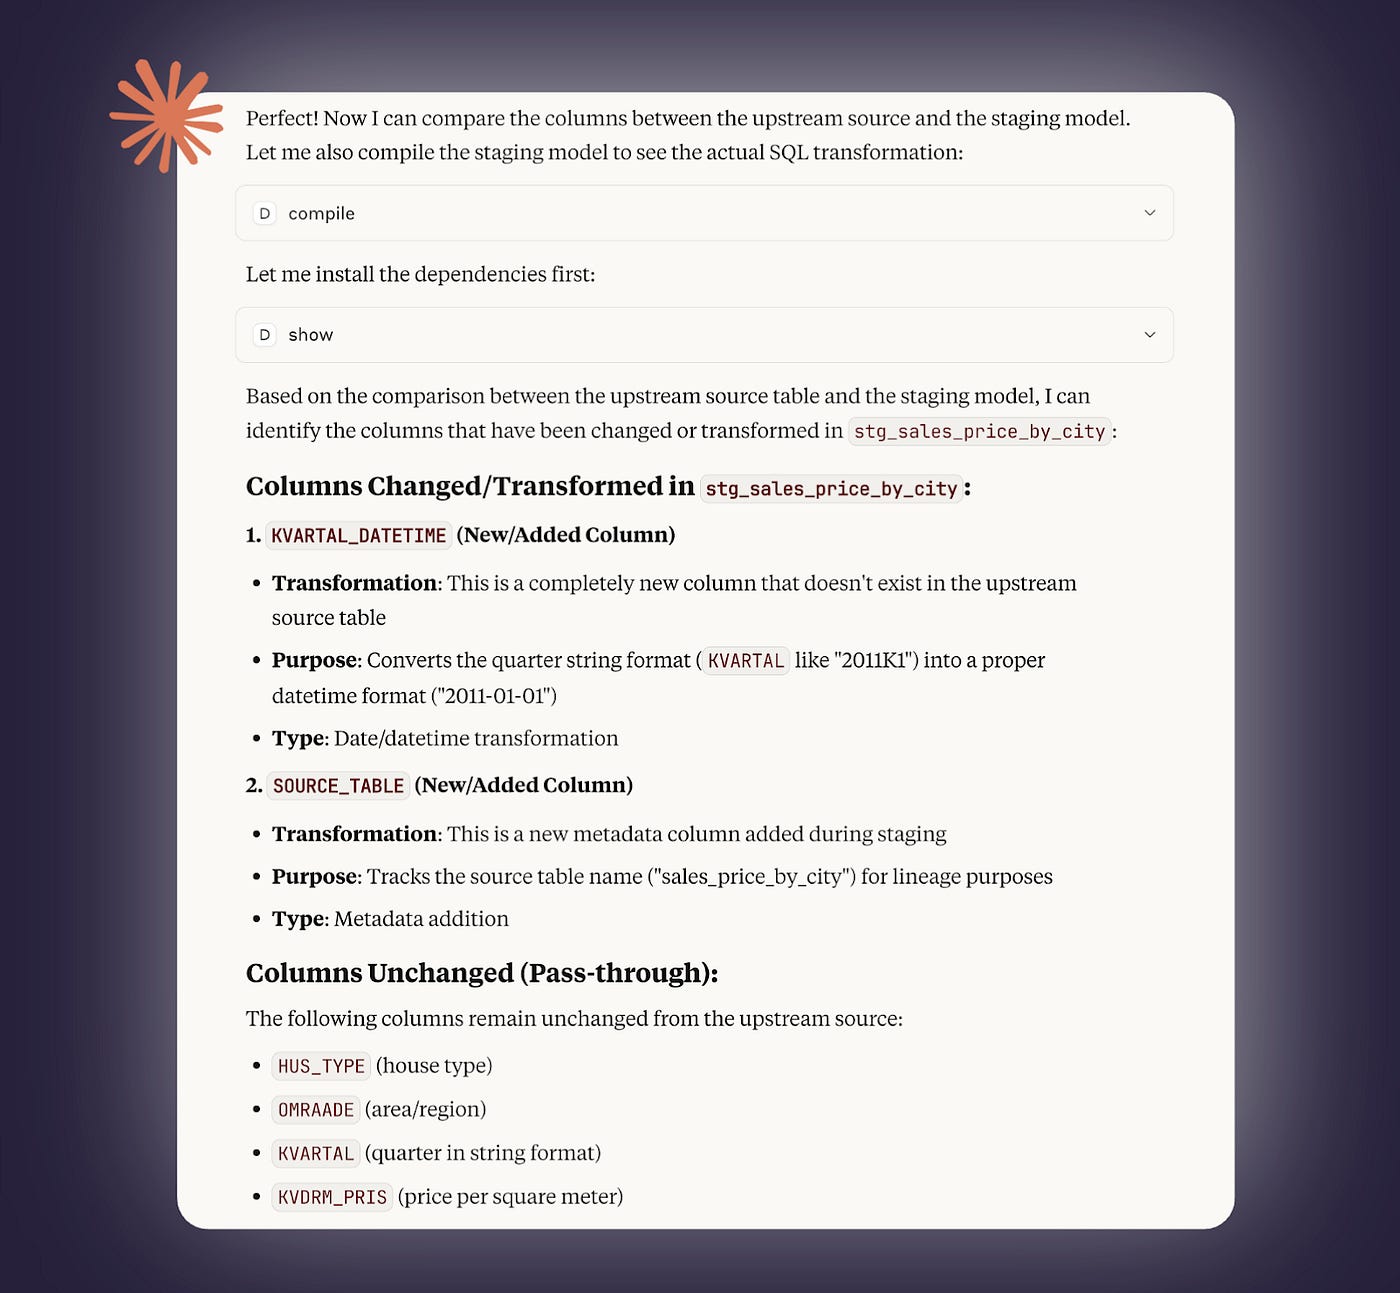
When testing transformation, our main philosophy is test less. In other words, we only want tests when it’s necessary, such as when we transform a column or make a join. Claude has full access to our dbt project and can help us identify which ones they are.
✨Prompt: Show me which columns in the stg_tales_price_by_city model have been changed and which ones are passthrougHere’s an example of how that looks for the staging table stg_sales_price_by_city. Unchanged/passthrough fields are already tested thoroughly upstream through our source-level testing strategy, so there’s no need to test these again.
With this in mind, let’s add some tests.
✨Prompt: Take one staging model at a time and add relevant tests in line with the provided testing strategyWith the dbt MCP server, Claude can add some relevant, contextual tests that test for assumptions we want to guardrail against from our data transformations.
- name: stg_sales_price_by_city
  columns:
    - name: KVARTAL_DATETIME
      description: "Datetime column transformed from KVARTAL string format"
      tests:
        # Validate quarter start months only (1, 4, 7, 10)
        - dbt_utils.expression_is_true:
            expression: "EXTRACT(MONTH FROM KVARTAL_DATETIME) IN (1, 4, 7, 10)"
            config:
              severity: error

        # Ensure all dates are first day of quarter
        - dbt_utils.expression_is_true:
            expression: "EXTRACT(DAY FROM KVARTAL_DATETIME) = 1"
            config:
              severity: error
This is also a good step to add some unit tests.
✨Prompt: Add some realistic unit tests using synthetic data, but inspired by actual data pointsAnd we get some reasonable data points for our unit tests.
unit_tests:
  - name: test_kvartal_to_datetime_q1
    description: "Test Q1 transformation: YYYYK1 -> YYYY-01-01"
    model: stg_sales_price_by_city
    given:
      - input: source('real_estate', 'SALES_PRICE_BY_CITY')
        rows:
          - {HUS_TYPE: "Test House", OMRAADE: "Test Area", KVARTAL: "2023K1", KVDRM_PRIS: "15000"}
          - {HUS_TYPE: "Test House", OMRAADE: "Test Area", KVARTAL: "2021K1", KVDRM_PRIS: "12000"}
    expect:
      rows:
        - {HUS_TYPE: "Test House", OMRAADE: "Test Area", KVARTAL: "2023K1", KVARTAL_DATETIME: "2023-01-01", KVDRM_PRIS: "15000", SOURCE_TABLE: "sales_price_by_city"}
        - {HUS_TYPE: "Test House", OMRAADE: "Test Area", KVARTAL: "2021K1", KVARTAL_DATETIME: "2021-01-01", KVDRM_PRIS: "12000", SOURCE_TABLE: "sales_price_by_city"}
As requested, we don’t get redundant tests on passthrough fields that are already tested upstream.
Testing metrics
The last step is testing our final metrics that we’ll expose to Omni in Part 3. Our metrics are the most downstream layer in our data models, so we care less about data quality tests like uniqueness and not null, and more about actual business assumptions about them.
As a first step, let’s get Claude to help us describe the metrics.
✨Prompt: Give me some relevant descriptive statistics about my metrics (metrics.yml) that I can use for deciding on testsThis gives us some helpful statistics about key metrics and potential data quality issues.

✨Prompt: Give me relevant tests for each metric based on the assumptions aboveMany of the tests, such as minimum value checks, are reasonable, and we’ll keep those around. However, Claude suggests a bunch of hardcoded threshold tests to detect if the metric significantly deviates from the mean. These can be fragile to have hardcoded, and I prefer for them to be adaptive, so we’ll ask Claude to replace them with a tag: synq_metric_anomaly_monitor, which will add a self-learning anomaly monitor instead.
- name: outlier_spike_monitoring
    description: "Monitor for unusual spikes in outlier records"
    sql: |
      WITH recent_outliers AS (
        SELECT
          COUNT(CASE WHEN KVDRM_PRIS > 50000 THEN 1 END) as high_price_outliers,
          COUNT(CASE WHEN DAGE_PAA_MARKED > 500 THEN 1 END) as long_market_outliers,
          COUNT(*) as total_records
        FROM {{ ref('house_statistics') }}
        WHERE DATE_DAY >= CURRENT_DATE - INTERVAL '7 days'
      ),
      historical_outliers AS (
        SELECT
          COUNT(CASE WHEN KVDRM_PRIS > 50000 THEN 1 END) * 7.0 / COUNT(*) as hist_high_price_rate,
          COUNT(CASE WHEN DAGE_PAA_MARKED > 500 THEN 1 END) * 7.0 / COUNT(*) as hist_long_market_rate
        FROM {{ ref('house_statistics') }}
        WHERE DATE_DAY >= CURRENT_DATE - INTERVAL '90 days'
        AND DATE_DAY < CURRENT_DATE - INTERVAL '7 days'
      )
      SELECT COUNT(*) as outlier_spikes
      FROM recent_outliers ro
      CROSS JOIN historical_outliers ho
      WHERE ro.high_price_outliers > ho.hist_high_price_rate * 3  -- 3x normal rate
      OR ro.long_market_outliers > ho.hist_long_market_rate * 3
Replacing hard-coded thresholds with anomaly monitors
✨Prompt: Whenever you’ve hardcoded thresholds such as standard deviation boundaries, replace that with tag: synq_metric_monitor and provide the needed SQL in the yml file (e.g., avg kvdm_pris)We now have a set of well tested data — from sources through transformations and metrics 🎉.
Here’s a recap of what we’ve done in Part 2
Defined a best-practice testing strategy
Used Claude to generate dbt tests with real data validation
Added source-level tests (e.g., not null, accepted values, regex patterns)
Supplemented tests with anomaly monitors via dbt tags
Used dbt’s MCP server to test staging and marts with rich context
Created realistic unit tests using synthetic but grounded data
Built metric-level tests based on business assumptions and exploration
In Part 3, we’ll bring everything together with Omni dashboards and a self-serve AI-powered semantic layer.